
linqi process analysis – your tool for optimal project management
Every process has potential – and with linqi, you can make that potential visible. The process analysis function gives you a clear overview of the sequence, utilization, and potential weak points of your workflows at any time. With just a few clicks, you can evaluate processes, recognize bottlenecks, and identify potential for improvement. Whether it’s throughput times, processing statuses, or returns, all important key figures are clearly presented and can be accessed at any time. This allows you to see at a glance where processes are running smoothly and where there is room for optimization, compare developments over time, and measure the success of your measures.
linqi makes process analysis simple and understandable: you receive meaningful evaluations, identify patterns, bottlenecks, and focal points in your processes, and derive targeted measures to make business processes more efficient, faster, and less error-prone—quickly, intuitively, and easily. The analysis functions can be used without prior knowledge and provide transparent representations of throughput times as well as clear indications of where processes are stalling or errors are accumulating – so you can prioritize improvements based on data and implement them effectively.
Process analysis with smart functions
linqi process analysis makes processes measurable, comparable, and specifically improved.
Four steps to better processes:
- Select process:
Select the desired workflow or process in linqi. - Activate analysis:
Let linqi automatically collect relevant metrics and data. - Evaluate results:
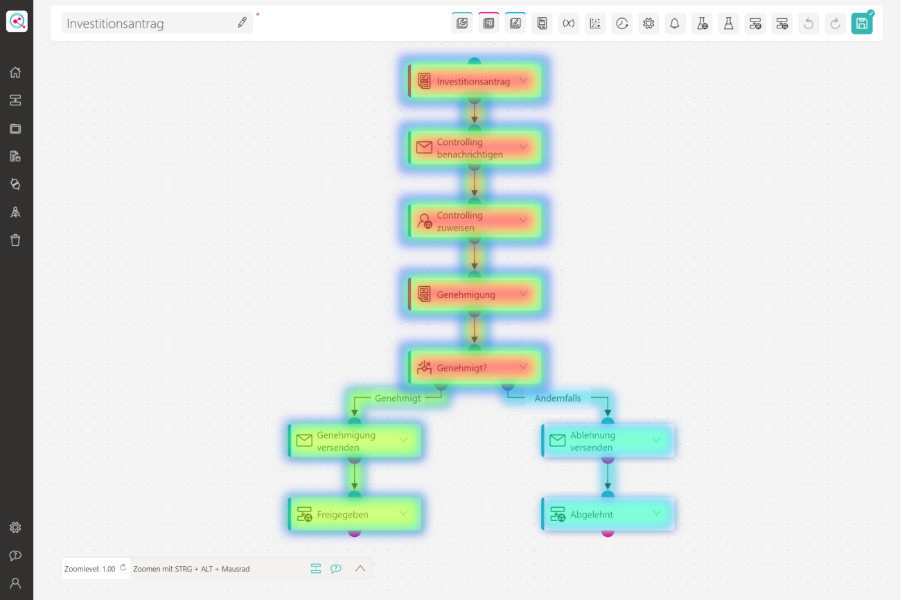
Use the clear heat maps to identify bottlenecks, runtimes, or anomalies. - Derive and optimize measures:
Derive targeted improvements and implement them directly in your workflows.
With these four steps, you can create a robust data basis for continuous process improvement—without any additional effort and directly in linqi. You can see at a glance where throughput times are increasing, tasks are being left undone, or returns are occurring, and you can prioritize measures based on data. Compare time periods, teams, or locations, measure the success of your optimizations, and share results with the responsible process participants at the click of a button. This turns process analysis into an ongoing, transparent improvement cycle – simple, fast, and traceable.
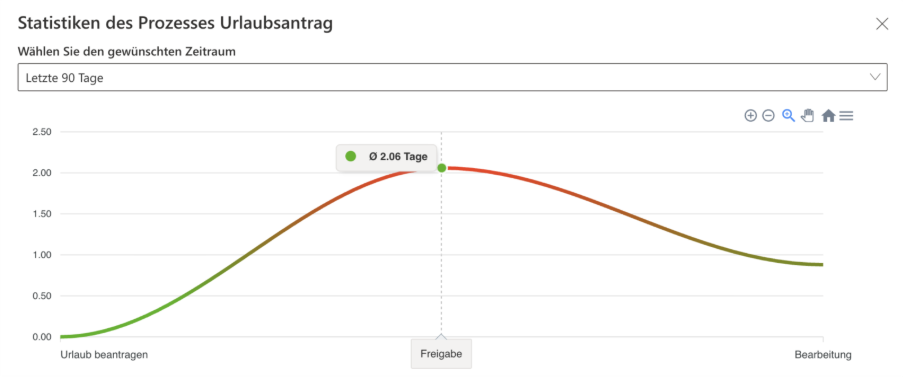
Exemplary process metrics for a vacation request
With linqi, you can analyze every step of the process without time-consuming evaluations or complicated IT solutions – from the start of the process to its completion, with clear metrics, trends, and recognizable outliers. In the case of a vacation request, for example, linqi allows you to see at a glance how often the process has been run, how long processing typically takes, and where waiting times occur, so you can address bottlenecks, shorten processing times, and make the process more efficient.
- Number of executions: How often was the process executed during the selected period? (e.g., 22 times)
- Average execution time: How long does a complete process take on average? (e.g., 2.94 days)
- Average execution time per stage: How much time is required on average for a single step? (e.g., 0.98 days)
- Longest execution time: How long did the slowest process run take? (e.g., 21.76 days)
- Shortest execution time: How long did the fastest process run take? (e.g., 0.02 days)
- Trend: How is the processing time changing over time? (e.g., increasing execution time)
Frequently asked questions about process analysis
What is a process analysis?
A process analysis is the systematic evaluation of processes in order to identify weaknesses, bottlenecks, and potential for improvement.
Which key figures are relevant for process analysis?
Important key figures include, for example: number of process executions, average processing time, longest and shortest throughput time, as well as trends and bottlenecks in individual process steps.
How does process analysis help optimize workflows?
It shows where processes are stalling or taking too long. This allows targeted improvements to be implemented and processes to be made more efficient.
What are the benefits of a heat map in process analysis?
A heat map shows which process steps are used particularly frequently or are heavily loaded. This makes it easy to identify focal points, patterns, and potential bottlenecks.
How often should a process analysis be performed?
Regularly—for example, after introducing new processes, when changes are made to procedures, or at fixed intervals in order to continuously identify potential for optimization.
For which use cases is process analysis particularly useful?
Wherever processes are repeated, e.g., for approvals, applications, reviews, or multi-stage workflows.